Whether you are solving a physical chemistry homework problem where activation energy suddenly came out off by a factor of 1,000, trying to verify a four-point Arrhenius plot slope and Eyring transition-state parameters () for a lab report, or predicting half-life () and 90% shelf-life () in accelerated stability testing, almost every kinetics error boils down to four traps: leaving °C instead of Kelvin, mixing kJ/mol with J/(mol·K), dividing by 2.303 vs natural log, or flipping .
This guide gives you a single reference table for all key kinetics equations, explains when to choose CODATA vs textbook , walks through five independently verified worked examples (with clickable pre-filled links into the Arrhenius Equation & Reaction Rate Calculator), and outlines when simple Arrhenius linearity breaks down.
Quick Reference: Essential Arrhenius, Eyring & Integrated Rate Equations
| Domain / Goal | Core Equation | Variables & Required Units | Practical Rule / Watchout |
|---|---|---|---|
| Arrhenius Equation | : rate constant : pre-exponential factor : activation energy : absolute temperature |
Multiply in kJ/mol by 1000 before dividing by ; never plug in °C | |
| Linearized Arrhenius Plot | Y-axis: X-axis: Slope: |
If plotting common log , multiply slope by instead of | |
| Two-Temperature Form | : Kelvin : rate constants at |
Keep and aligned so positive gives positive | |
| Eyring Equation (TST) | : enthalpy of activation : entropy of activation |
Plots vs directly; for unimolecular steps, | |
| Zero-Order Kinetics | () | Linear decay to zero at ; common in enzyme/catalyst saturation | |
| First-Order Kinetics | () | Constant independent of ; shelf-life is | |
| Second-Order Kinetics | () | Plot vs for linearity; each successive half-life doubles |
Gas Constant : CODATA Exact Value vs Rounded Textbook Values
Small trailing-digit mismatches between your calculator and an answer key usually trace back to which standard value of the molar gas constant was used:
| Standard | Value of | Definition / Source | When to Use |
|---|---|---|---|
| Exact SI / CODATA 2022 | Exact product post-2019 SI | University labs, Excel/OLS plots, Eyring analysis, stability modeling | |
| Rounded Textbook Standard | 3-sig-fig exam convention | Standardized tests or textbook problems explicitly stating |
For a reaction whose rate exactly doubles between and , exact CODATA yields , whereas rounded yields (~0.054% difference). You can toggle between both modes directly inside the Arrhenius Calculator.
Visual Guide: Arrhenius Slope () & Half-Life Decay by Reaction Order
Understanding the geometry of both graphs prevents almost every conceptual error in chemical kinetics:
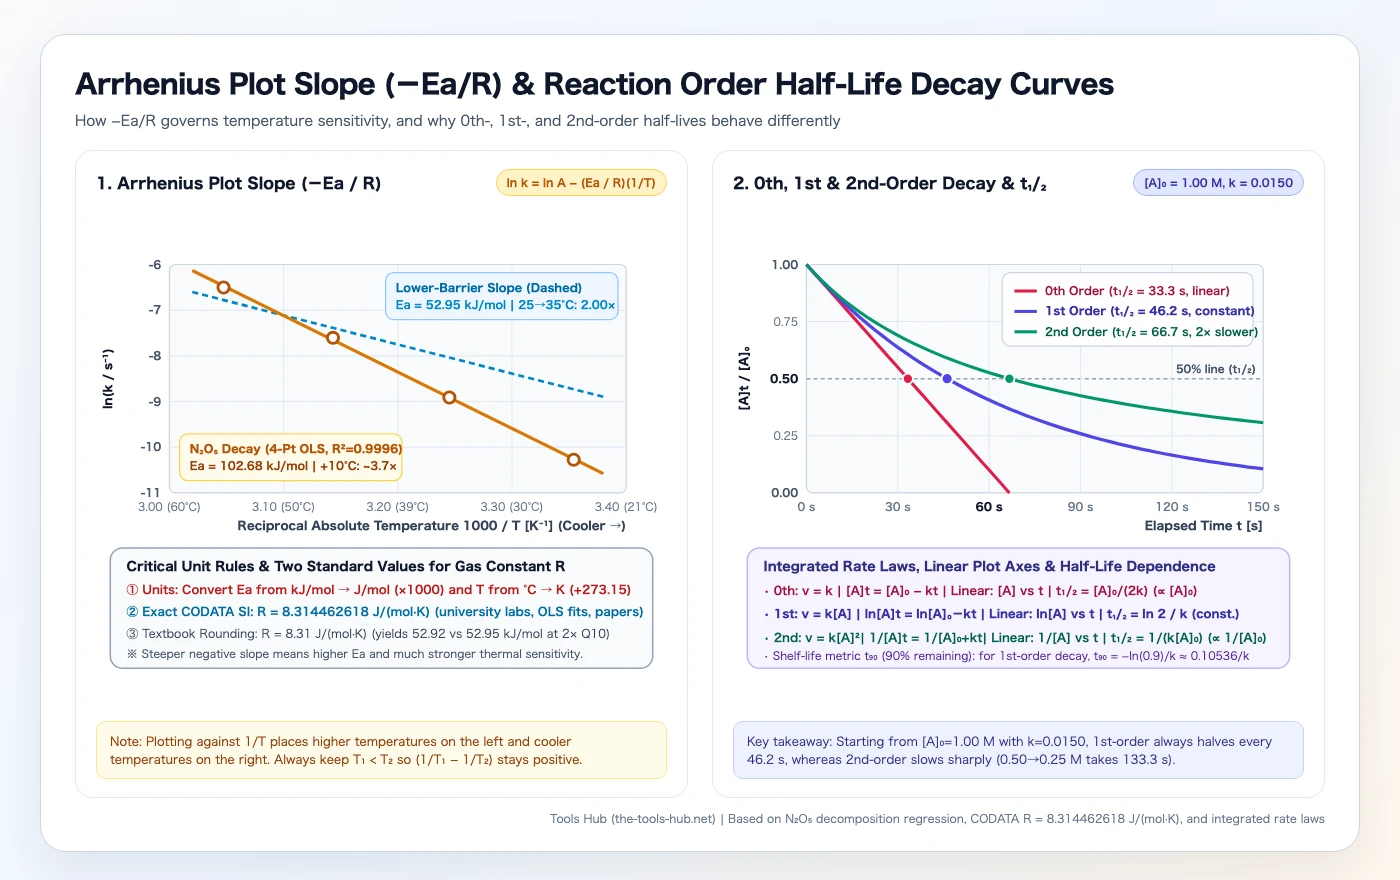
On the left panel, because the x-axis plots reciprocal temperature , hotter conditions sit on the left and cooler conditions sit on the right. A steeper negative slope indicates a higher activation energy —meaning reaction rate rises sharply per 10 °C increase.
On the right panel, all three reaction orders begin at with numerically identical :
- Zero-order falls in a straight line ($t_{1/2} = 33.3\text{ s}$) and hits zero completely at $66.67\text{ s}$.
- First-order decays exponentially with constant .
- Second-order reaches at , then slows dramatically because remaining molecules collide less often—taking just to go from .
Five Worked Examples (With One-Click Calculator Pre-Fill Links)
Example 1: Solving from Two Temperatures (The “+10 °C Rate Doubles” Rule)
Problem: A reaction doubles its rate constant () when warmed from to . Find in using CODATA .
- Convert temperatures to Kelvin: , .
- Compute reciprocal difference: .
- Solve for :
This explains why the classic rule of thumb (“reaction rates double every 10 °C near room temperature”, ) corresponds specifically to reactions with .
👉 Load Example 1 into the Arrhenius Calculator to Verify
Example 2: Predicting Rate Constant at Higher Temperature ( Decay)
Problem: For decomposition, and at . Predict at .
- Convert units: , , .
- Compute log ratio:
- Exponentiate and multiply:
👉 Load Example 2 (N₂O₅ 25°C → 45°C Prediction) into the Calculator
Example 3: Finding Target Temperature for a 10× Speedup
Problem: A process has . Starting at (), what temperature makes the reaction 10.0 times faster?
- Rearrange for :
- Invert and convert back to Celsius:
👉 Load Example 3 (Target Temperature for 10× Rate) into the Calculator
Example 4: Multi-Point OLS Arrhenius Plot & Eyring Transition-State Analysis
Dataset ( decomposition across 4 temperatures):
(25.0 °C, 3.46e-5 s⁻¹),(35.0 °C, 1.35e-4 s⁻¹),(45.0 °C, 4.98e-4 s⁻¹),(55.0 °C, 1.50e-3 s⁻¹)
Running ordinary least-squares regression of vs across all four points gives:
- Activation Energy: ()
- Pre-exponential Factor:
- Eyring Enthalpy of Activation at 25.0 °C:
If you want to review the underlying regression formulas for slope confidence intervals and , see our Least Squares Linear Regression Guide.
👉 Load Example 4 (4-Point Arrhenius Plot & Eyring Fit) into the Calculator
Example 5: Integrated First-Order Decay, Half-Life , and Shelf-Life
Problem: Given and first-order , compute after , half-life , and (time for 10% loss).
- Remaining concentration:
- Half-life:
- 90% remaining time ():
👉 Load Example 5 (First-Order Decay, t₁/₂ & t₉₀) into the Calculator
Common Mistakes & Physical Limits of Ideal Arrhenius Kinetics
Four Mistakes to Double-Check Before Submitting
- Using Celsius directly: Never write ; always convert to Kelvin first.
- Factor-of-1,000 unit mismatch: Remember most organic/inorganic reactions sit in the range. Getting or almost always means you forgot .
- Using base-10 log (
LOG10) in spreadsheets with-R: If your sheet computes instead of natural log , multiplying slope by underestimates by . Always useLN(k). - Assuming every half-life stays constant: Only 1st-order decay keeps constant ; 0th- and 2nd-order half-lives shift as concentration changes.
When Real Systems Deviate from Linear Arrhenius Behavior
- Quantum tunneling & temperature-dependent : Over wide temperature spans or light-atom proton transfers at low , plots of vs curve noticeably.
- Enzyme denaturation & phase changes: Biological catalysts lose activity abruptly above denaturation temperatures, producing sharp downward breaks on the high-temperature side (left side of the plot).
- Multi-step mechanisms: When the rate-determining step shifts with temperature, the fitted slope represents an apparent activation energy rather than a single elementary transition barrier.
Related Calculators & Further Reading
- Arrhenius Equation & Reaction Kinetics Calculator — Interactive two-temperature solver, multi-point OLS Arrhenius/Eyring analyzer, and 0th/1st/2nd-order decay tool.
- Least Squares Regression Calculator & Regression Guide — Detailed linear fitting, residuals, and checks.
- Natural & Common Logarithm Calculator & Logarithms Guide — Quick checks on vs conversions.
- Half-Life Calculator & Half-Life Guide — Extended exponential decay workflows.
- Bond Energy & Enthalpy Calculator — Estimate reaction alongside kinetic barriers.
References
- IUPAC Compendium of Chemical Terminology (Gold Book) — Arrhenius equation (A00446) International standard definition of the Arrhenius equation and pre-exponential factor .
- IUPAC Compendium of Chemical Terminology (Gold Book) — Activation energy (A00102) Formal empirical definition .
- NIST CODATA 2022 — Molar Gas Constant R Exact SI value of the molar gas constant ().
- OpenStax Chemistry 2e — Section 12.5: Collision Theory & Arrhenius Equation Standard derivation of collision theory, activation barriers, and two-temperature Arrhenius plotting.
- OpenStax Chemistry 2e — Section 12.4: Integrated Rate Laws & Half-Life Derivation of 0th-, 1st-, and 2nd-order integrated rate equations and half-life dependencies.
FAQ
Why did my two-temperature Arrhenius calculation give a negative activation energy Ea?
The most frequent cause is swapping the subscripts between ln(k₂/k₁) and (1/T₁ − 1/T₂). When T₂ > T₁ and the reaction speeds up (k₂ > k₁), both ln(k₂/k₁) and (1/T₁ − 1/T₂) are positive. If you write (1/T₂ − 1/T₁) instead, you must flip the left-hand side to ln(k₁/k₂).
Should I use R = 8.3144626 (CODATA) or R = 8.31 J/(mol·K)?
Use R = 8.314462618 J/(mol·K) (the exact SI CODATA value derived from Avogadro and Boltzmann constants) for university physical chemistry labs, Arrhenius plot OLS regression, and stability studies. Only use R = 8.31 when an exam prompt explicitly instructs that rounded constant. At 25°C to 35°C with a 2× rate doubling, the difference is 52.95 vs 52.92 kJ/mol (~0.05%).
Why is multi-point linear regression (ln k vs 1/T) better than averaging pairs of temperatures?
Computing Ea from a single pair of temperatures amplifies any experimental error in k or T by 1/(1/T₁ − 1/T₂). An ordinary least-squares (OLS) fit of ln k vs 1/T averages random measurement noise across all points and reports R² and slope standard error (±SE) so you can check whether the reaction truly follows Arrhenius linearity.
How do 1st- and 2nd-order half-lives differ, and what is t₉₀?
A first-order half-life t₁/₂ = ln(2)/k is independent of initial concentration [A]₀, so every successive halving takes the exact same time. A second-order half-life t₁/₂ = 1/(k[A]₀) depends inversely on concentration, doubling each time concentration halves. Shelf-life metric t₉₀ is the time until 90% of initial material remains (10% degradation), equal to −ln(0.9)/k ≈ 0.10536/k for first-order decay.