Bernoulli’s equation relates static pressure, velocity and elevation through mechanical energy. When a pipe changes diameter, find velocity from continuity first, then use the pressure equation.
Choose an equation and calculator mode
| Task | Equation | Tool mode |
|---|---|---|
| Velocity after a diameter change | Q = A₁v₁ = A₂v₂ | Pipe flow & Bernoulli |
| Downstream static pressure | p₂ = p₁ + ρ(v₁²−v₂²)/2 + ρg(h₁−h₂) | Same mode |
| Venturi volume flow | Q = Cd A₂ √[2Δp/{ρ(1−β⁴)}] | Venturi & Pitot |
| Pitot-static velocity | v = √(2Δp/ρ) | Pitot fields in that mode |
| Initial discharge speed from head H | v₀ = √(2gH) | Torricelli / tank discharge |
A is area in m², v velocity in m/s, Q volume flow in m³/s, ρ density in kg/m³, p pressure in Pa, and h or H elevation/head in m. For circular internal diameters, A = πD²/4 and β = D₂/D₁. Cd is a discharge coefficient for specified conditions, not a universal constant.
Example 1: reducing a pipe from 100 mm to 50 mm
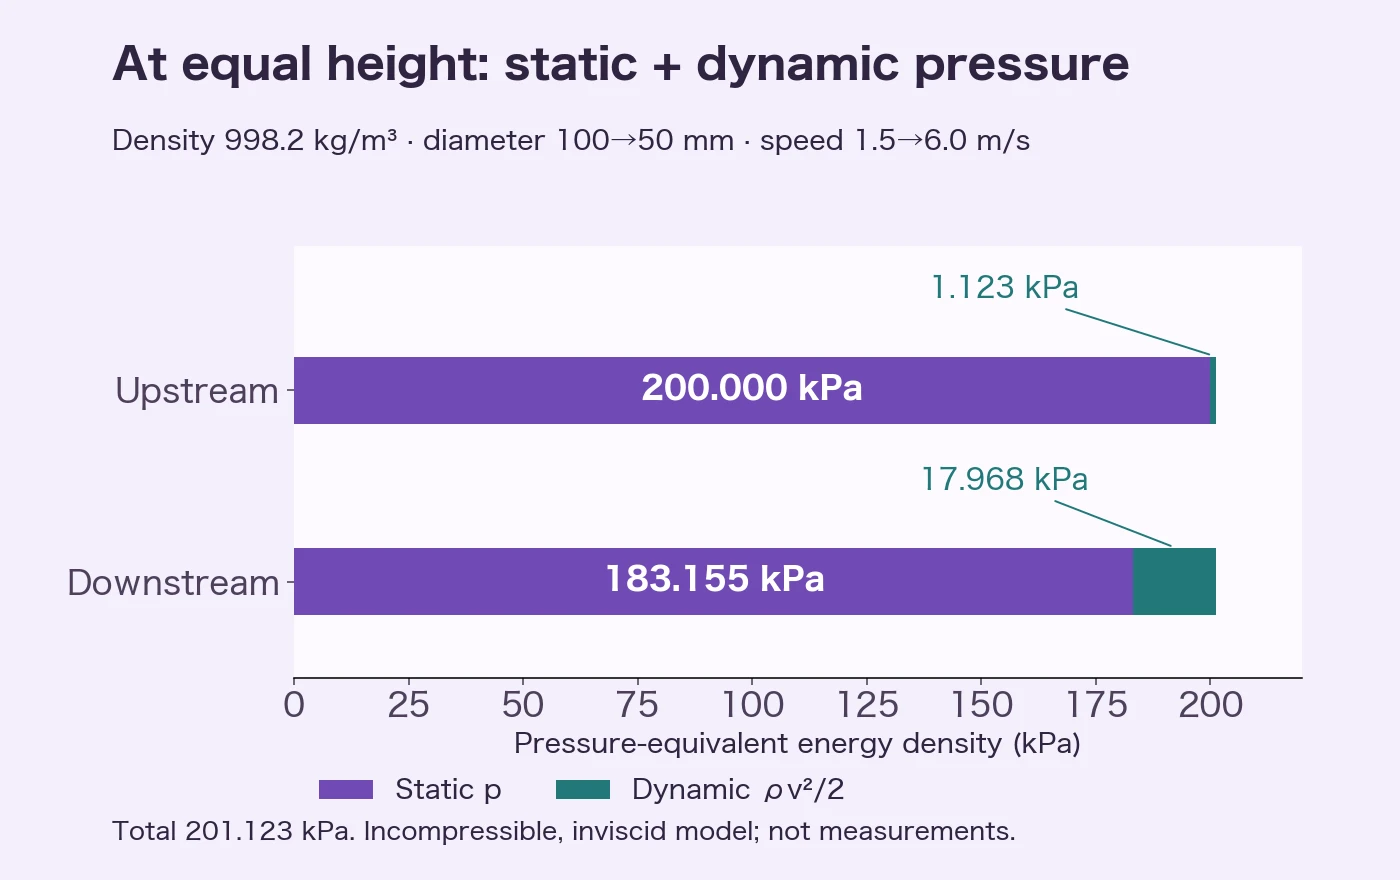
Assume density 998.2 kg/m³, upstream speed 1.5 m/s, upstream static pressure 200 kPa, both elevations zero, and g = 9.80665 m/s². Use internal diameters and neglect friction, fittings and pump work. These are hypothetical study inputs.
- D₁ = 0.100 m and D₂ = 0.050 m.
- v₂ = 1.5 × (0.100/0.050)² = 6.0000 m/s.
- Q = π × 0.100²/4 × 1.5 = 0.01178097 m³/s ≈ 11.78 L/s.
- Dynamic-pressure increase = 998.2 × (6²−1.5²)/2 = 16844.625 Pa.
- p₂ = 200000−16844.625 = 183155.375 Pa ≈ 183.16 kPa.
Dynamic pressure rises from 1.122975 to 17.9676 kPa. At the same elevation, static plus dynamic pressure is 201.122975 kPa on both sides.
What if the outlet rises by 0.5 m?
Change only h₂ to 0.5 m. Pressure drops by another ρg × 0.5 = 4894.50 Pa, giving 178.26 kPa. If your answer stays at 183.16 kPa, check whether you omitted elevation.
Keep the pressure reference consistent
Use the same reference at both ends. A 200 kPa gauge input produces a 183.16 kPa gauge output. To consider vapor formation, convert to absolute pressure and compare with vapor pressure at the fluid’s temperature. Negative gauge pressure is not negative absolute pressure.
Examples 2–4: inputs and expected results
The following hypothetical conditions match the calculator presets.
| Example | Inputs and assumptions | Result to check |
|---|---|---|
| Venturi | D₁=80 mm, D₂=40 mm, Δp=12 kPa, ρ=998.2 kg/m³, Cd=0.98 | Q ≈ 6.24 L/s |
| Pitot-static | Δp=2.5 kPa, air density 1.204 kg/m³, incompressible approximation | 64.44 m/s = 232.0 km/h |
| Tank outlet | Initial H=2.5 m, outlet diameter 25 mm, tank diameter 1.2 m, Cd=0.62, both surfaces at atmospheric pressure | Initial ideal speed 7.002 m/s; initial actual flow 2.13 L/s; modeled emptying time about 2653 s (44 min 13 s) |
For Venturi substitution, use D₁=0.080 m, D₂=0.040 m, A₂=π×0.040²/4, β=0.5 and Δp=12000 Pa. A diameter ratio is not the same as an area ratio.
For Pitot calculations, Δp is stagnation pressure minus static pressure. Air density varies with pressure and temperature, and high speeds need compressibility corrections. This example does not validate flight instrumentation or flight safety.
When is emptying time twice the constant-initial-flow estimate?
For a large cylindrical tank of constant area A, small outlet area A₀, equal surface/outlet pressure, constant Cd, and drainage to zero depth,
Use A = π×1.2²/4 and A₀ = π×0.025²/4 to get about 2653 seconds. Keeping Q₀ = Cd A₀√(2gH) constant would give AH/Q₀ ≈ 1327 seconds, half as long. Actual modeled flow falls with depth. The factor of two is conditional, not universal for every tank: a narrow tank, line resistance, residual depth or varying Cd needs another model.
Reproduce the examples
- Open the Bernoulli calculator and choose the water-pipe constriction preset.
- Check v₂=6.0000 m/s, p₂=183.16 kPa and Q=11.78 L/s, including pressure units and elevations.
- Keep upstream elevation zero and set downstream elevation to 0.5 m. Check p₂=178.26 kPa.
- Use the Venturi, Pitot and tank presets for the remaining examples. Record the input conditions in your report.
Avoid rounding intermediate calculations; round the final answer to the problem’s required precision. See unit conversion and significant figures. For later use, save the tool to favorites and reopen it from My Tools in the same browser. This saves the tool entry, not its input values or results.
Limits of the calculation
- The basic equation models steady, incompressible, inviscid flow along one streamline. Real pipe analysis with section-average velocities may require kinetic-energy correction and losses.
- Pipe loss, pumps, turbines, viscosity and compressibility go beyond this basic model.
- The low-pressure flag is a simple notice. Fluid temperature, vapor pressure and pressure reference are not supplied to a diagnostic model, so the tool cannot automatically determine cavitation.
- The ISO 5167-4:2022 public catalog establishes the standard’s title and Venturi scope. The calculator does not certify compliance with the full standard’s geometry, installation requirements or operating limits.
Questions
Does a narrower pipe always mean lower pressure?
Under this example’s equal-density, equal-elevation, lossless conditions without external work, acceleration accompanies a static-pressure decrease. Diameter alone is insufficient when supply conditions, elevation or losses differ.
Is the elevation term part of total pressure?
For Pitot usage, stagnation pressure at a given elevation is p + ρv²/2. Bernoulli’s expression also includes ρgh, a mechanical energy-density contribution from elevation. State the elevation reference rather than treating the terms as interchangeable.
Should Cd always be 0.98?
No. It is a study preset for this Venturi example. Device geometry, Reynolds number and installation matter. Use the specified coefficient or calibration value.
Checked on October 15, 2026
We independently recalculated the example velocities, pressures, flows and drainage time and compared them with the public tool. References now point to the correct fluid-mechanics chapter and the ISO 5167-4:2022 public overview. The figure is calculated from the stated assumptions, not experimental evidence, expert supervision or a compliance certificate.